RFPM-2M Energy gateway with improved application
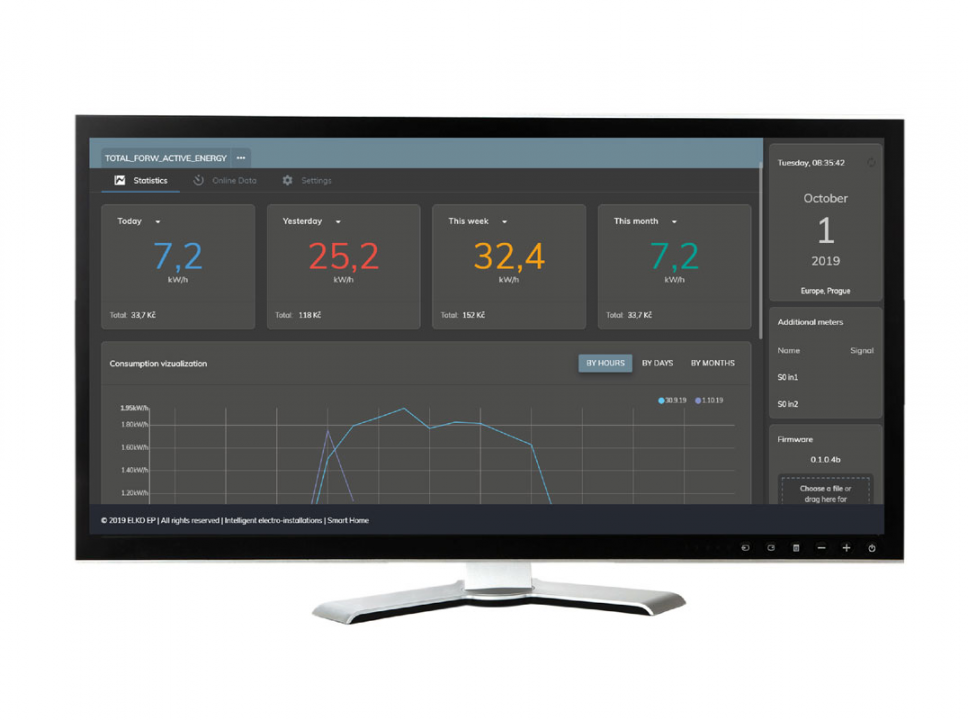
The Energy Gateway RFPM-2M web interface now has a completely new and cleaner visualization. This makes displaying and evaluating energy consumption even more convenient and easy.
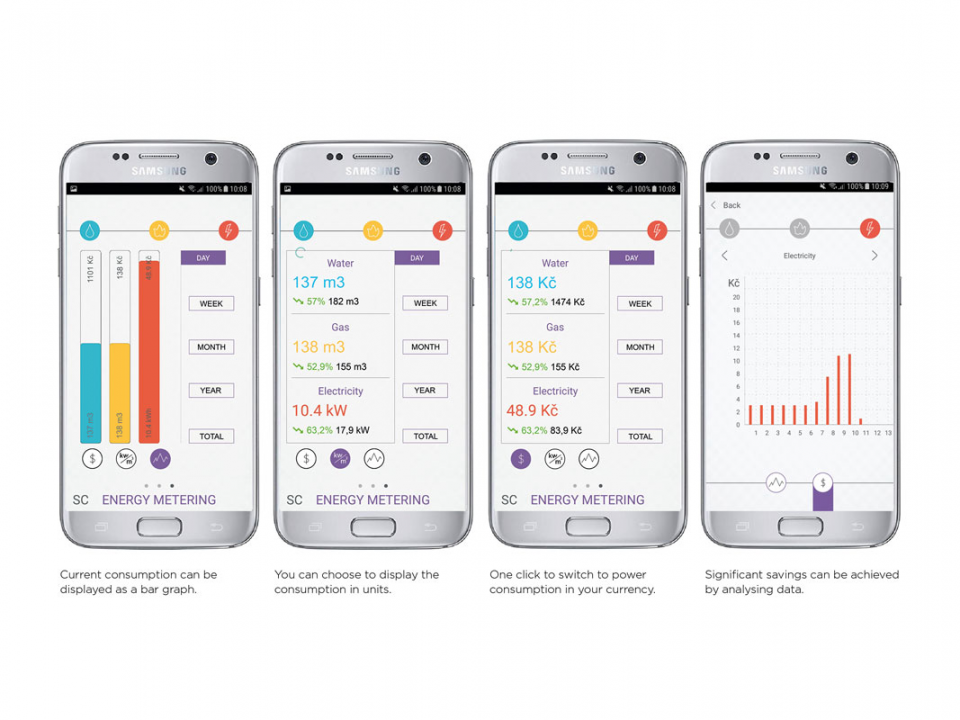
You can show a sample overview of energy consumption for a current day, a previous day, a current week or a month. Graphical visualization shows consumption by hours, days or months.
The Energy Gateway evaluates the following indicators in the network online: Phase current / voltage, phase overvoltage / undervoltage, asymmetry, distortion of the sine wave signal, distortion of sine wave signal flow, frequency, active performance, reactive power, apparent performance, power factor, phase voltage shift between phases.
All basic and advanced settings are made simply, quickly and intuitively. If you have any questions, a phone/e-mail technical support is available for you.
Measured data can be displayed not only through the web interface on the PC but also in the application iNELS Home Control (iHC). The measured values of all quantities can be monitored, but above all archived and analyzed in many selected time periods (daily, weekly, monthly and yearly). Consumption can be quantified in consumed units or directly in financial costs. Another advantage is the possibility of measuring electricity consumption in up to 4 tariffs.
You can try a demo version of the web interface on the website:
http:// http://217.197.144.56:2130/
Login: admin
Password: admin